City Dashboards are typically deployed by stakeholders such as municipalities, provinces or any other organization interested and involved in urban planning. Dashboards provide cities with visual insights about various indicators in their city environment, such as air quality, emissions, traffic, and road safety. These insights can be generated in real-time, based on different current, as well as historical, data that has been collected in the past. Examples of such data can be real-time sensor data which can be provided by IoT sensors owned by inhabitants or by a municipality, road authority, etc. (e.g., air quality sensors) and by sensors that are part of the road infrastructure, such as loop detectors that count traffic. Dashboards provide stakeholders with clear visual support, in the decision-making processes for steering towards their climate neutrality goals, and can be used as a quick, clear and tangible tool to provide a good overview of the KPIs of interest in a city. They enable the various stakeholders to quickly inspect the current situation in a city and use these insights during the urban planning process. For example, energy companies and power grid operators may be interested in KPIs related to e.g., demand for electric vehicle charging. Further, emissions can indicate critical parts of the network that require attention, while potential improvements after implementation of specific measures can be monitored easily. Individual KPIs, if desired, can be presented in different forms, such as tables, charts, graphs, text etc., other than maps. In addition to visualization of KPIs, a dashboard can also show in which areas only a few sensors are installed, which means that it can indicate in which areas it may be beneficial to deploy additional sensors to get a better overview and monitoring of the city.
Dashboards can assist stakeholders in several domains, which can result in a better living environment of citizens. On top of that, via citizen participation actions, citizens can be involved in getting awareness of their city conditions, as well as in participating in the decision-making processes.
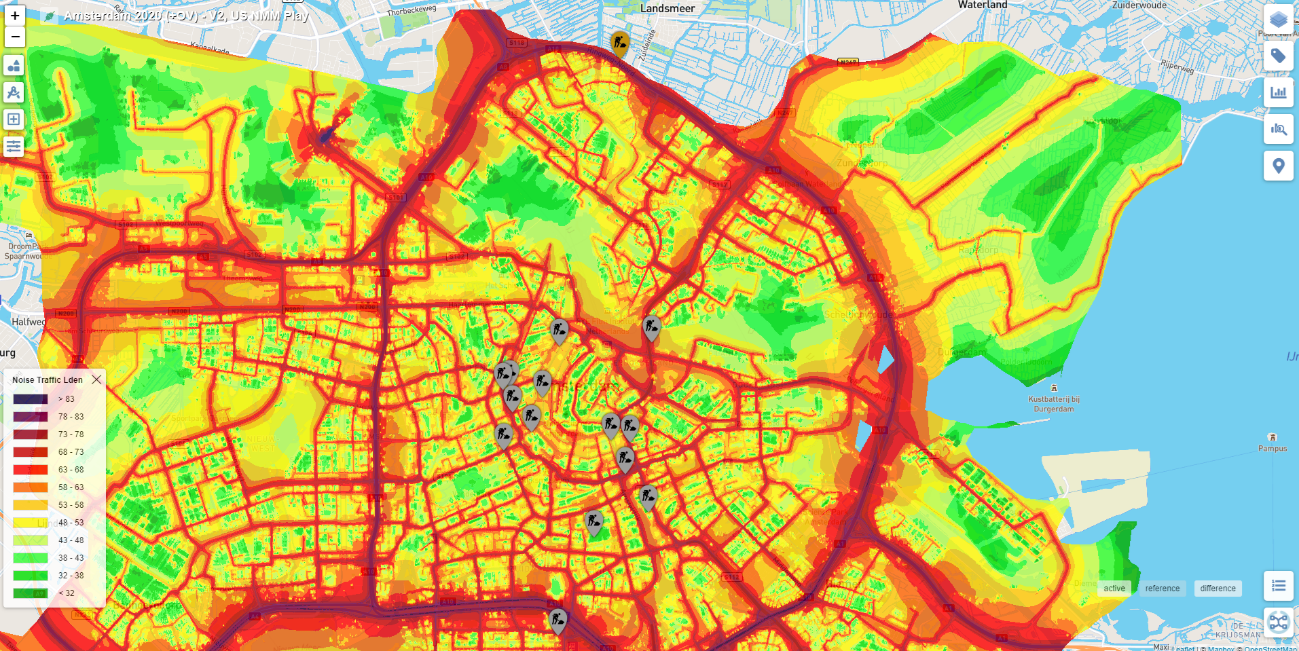
Figure 1: Inspecting noise levels in Amsterdam using a dashboard (source: TNO)
Comments ()